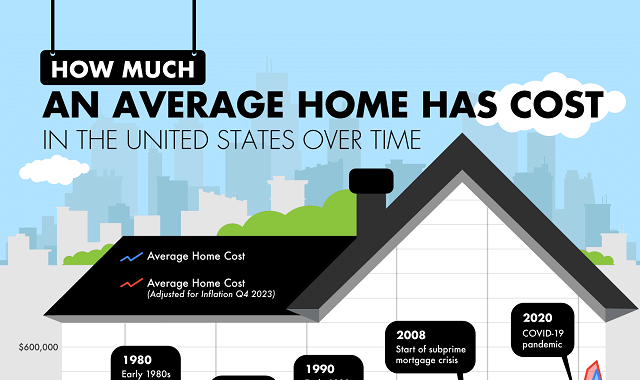
If you’ve bought or sold a home in the past few years, you know that the housing market has been through some massive changes. As you can see from this graphic by Madison Trust Company, we are at an all time high in average American home costs. The graphic shows average costs year by year since 1963. This big picture shows us just how dramatically the housing landscape has changed over the decades. The COVID-19 pandemic marked the biggest increase, but we can see other dips and rises through the years. The 2007 mortgage crisis certainly had an impact on the market along with the foreclosures driven by the 2006 financial crisis. 2009 saw a huge drop in prices after the housing bubble burst. These statistics give us hope that today’s current high prices will drop once again. But we also know based on inflation and the general trends here, that prices have trended upward decade by decade.
Infographic by: madisontrust


