The reason behind setting up a limit of minimum wage is to
set a baseline income level for workers in a particular jurisdiction. Ideally the
amount is enough to cover basic needs like housing and food, but it is not
always guaranteed.
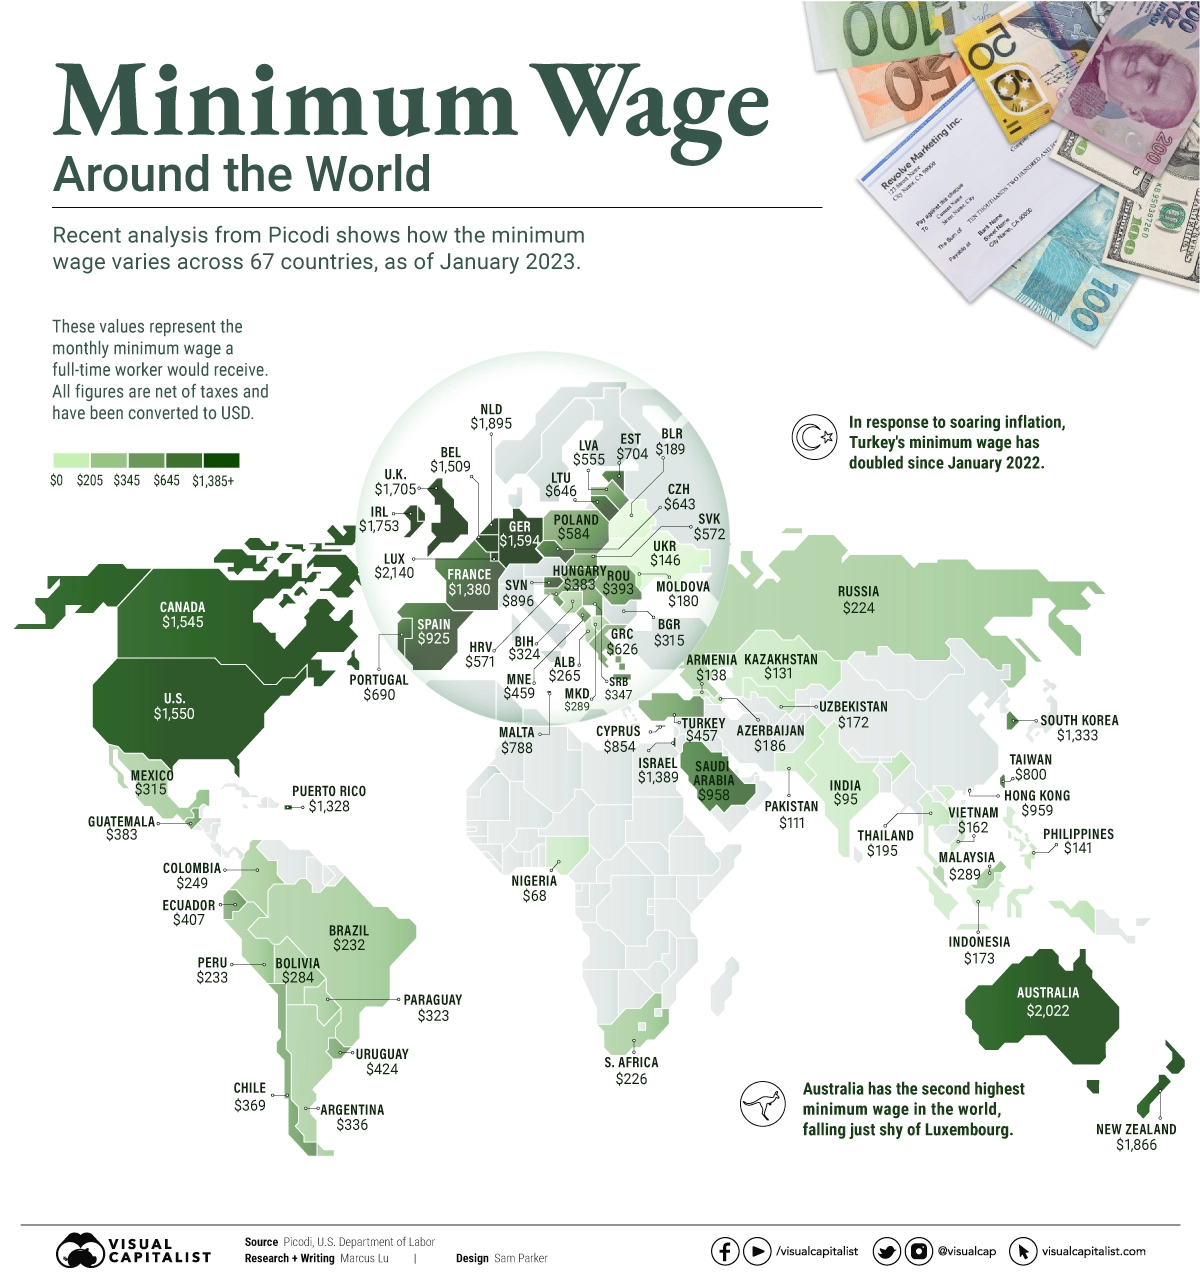
The data extracted from Picodi helps in analyzing how the
minimum wage differs around the world sand it includes values for 67 countries
as of January 2023.
Top 5 Countries with Most and Least Monthly Minimum Wages
The following table contains data from the infographic of
countries that have the most and least minimum wages.
Each value represents the monthly minimum wage a full-time
worker would receive in each country. Picodi states that these figures are net
of taxes and have been converted to USD.
|
Country |
Increase compared to Jan 2022 |
Minimum wage as of Jan 2023
(full-time, USD) |
|
Most Monthly Minimum Wages |
||
|
Luxembourg |
9.2% |
$2,140 |
|
Australia |
4.7% |
$2,022 |
|
New Zealand |
5.4% |
$1,866 |
|
Ireland |
5.1% |
$1,753 |
|
UK |
7.2% |
$1,705 |
|
Least Monthly Minimum Wages |
||
|
Nigeria |
0.0% |
$68 |
|
Uzbekistan |
11.4% |
$72 |
|
India |
8.1% |
$95 |
|
Pakistan |
24.5% |
$111 |
|
Kazakhstan |
16.4% |
$131 |
In general, developed countries have a higher cost of living, and thus require a higher minimum wage.
Minimum Wage in the United States per Hour
Minimum wages vary significantly within the United States. Each
state has a different limit - 16.10 being the highest and 7.25 being the lowest
minimum hourly wage among different states.
America’s federal minimum wage has remained unchanged since
2009 at $7.25 per hour.
Each state is allowed to set their own minimum wage, as long
as it’s higher than the federal minimum. In states that do not set their own
minimum, the federal minimum applies.
If we assume someone works 40 hours a week, the federal
minimum wage of $7.25 translates to an annual figure of just $15,080 before
taxes. For example, minimum wage in California of $15.50 translates to $32,240
before taxes.


