The Most Preferred Christmas Gifts in the U.S. this Season #Infographic - Visualistan -->

    Social Items

The Most Preferred Christmas Gifts in the U.S. this Season


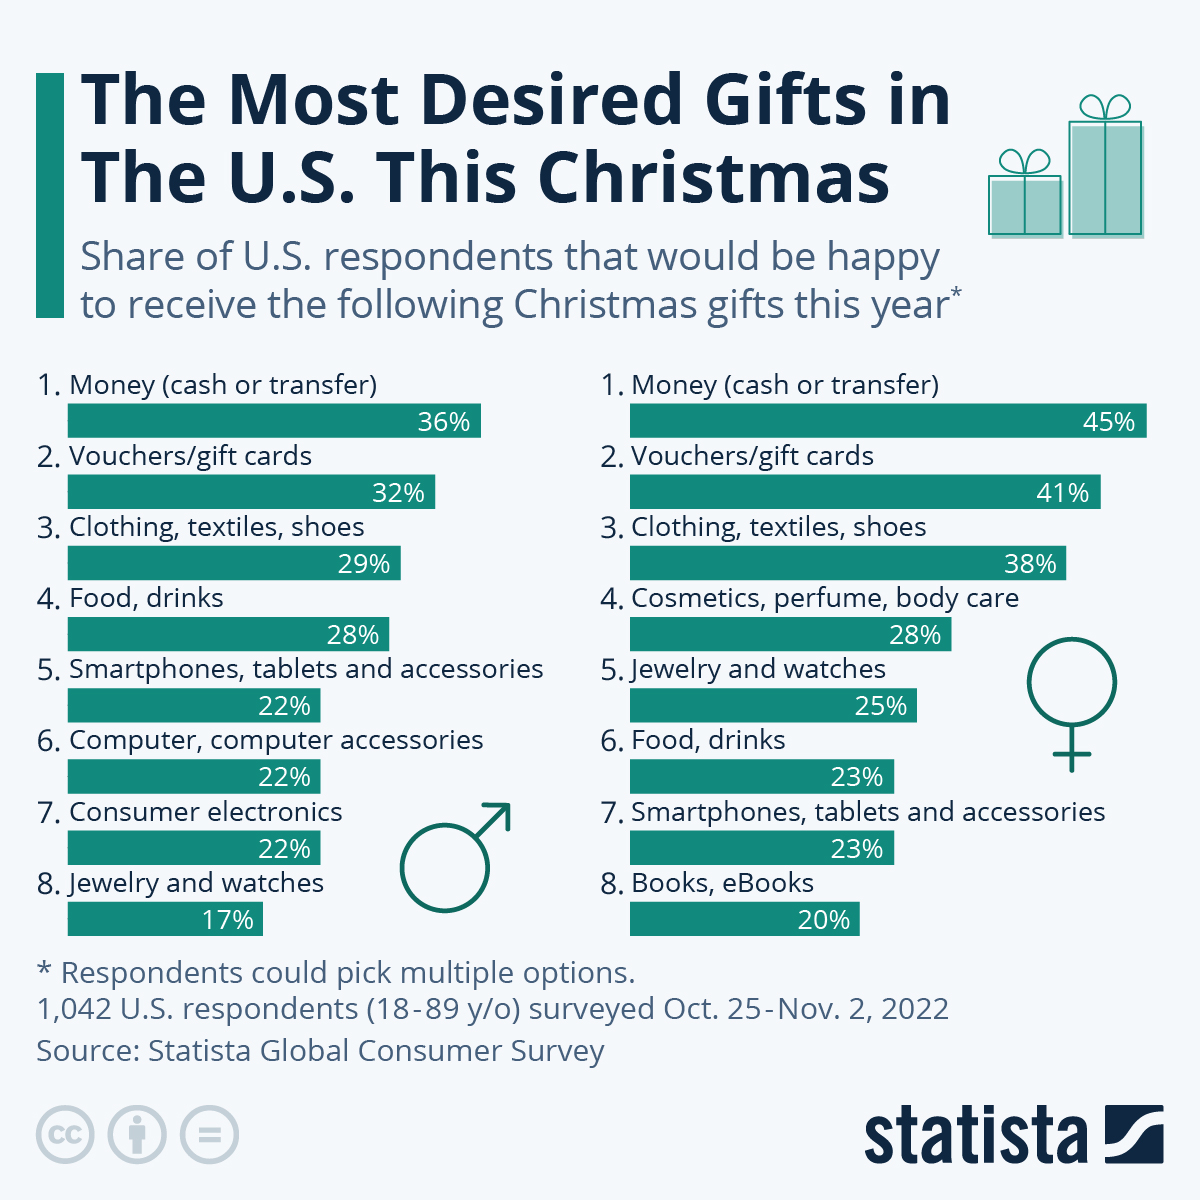
Even though money does not seem like the most attractive gift, yet it is the most desired Christmas present this year in the United States. According to the latest data from Statista’s Global Consumer Survey (Christmas and Holiday Season: U.S.), when U.S. adults were questioned which gifts they would personally like to receive the most this year, 46 percent of women and 36 percent of men  said cash or bank transfers. Vouchers were the second priority, followed by clothing, textiles or shoes in third position. Respondents had the option to choose from multiple options in the poll.


While analyzing the data for males and females, the breakdown shows that although there is a fair bit of overlap, some slight differences do appear. As the infographic shows, tablets, smartphones and accessories were a fairly common choice for both men and women, being selected by 22 percent and 23 percent of the groups, respectively. Women showed their interest slightly more in gifts related to travelling (19 percent versus men at 14 percent) as well as event tickets (19 percent versus men at 12 percent). Out of the polled preferences, ‘decoration articles’ were among the lowest scoring gifts, only preferred by 7 percent of female respondents and 6 percent of men.


The Most Preferred Christmas Gifts in the U.S. this Season


Infographic by: statista


Share This Infographic On Your Site

The Most Preferred Christmas Gifts in the U.S. this Season #Infographic

The Most Preferred Christmas Gifts in the U.S. this Season


Even though money does not seem like the most attractive gift, yet it is the most desired Christmas present this year in the United States. According to the latest data from Statista’s Global Consumer Survey (Christmas and Holiday Season: U.S.), when U.S. adults were questioned which gifts they would personally like to receive the most this year, 46 percent of women and 36 percent of men  said cash or bank transfers. Vouchers were the second priority, followed by clothing, textiles or shoes in third position. Respondents had the option to choose from multiple options in the poll.


While analyzing the data for males and females, the breakdown shows that although there is a fair bit of overlap, some slight differences do appear. As the infographic shows, tablets, smartphones and accessories were a fairly common choice for both men and women, being selected by 22 percent and 23 percent of the groups, respectively. Women showed their interest slightly more in gifts related to travelling (19 percent versus men at 14 percent) as well as event tickets (19 percent versus men at 12 percent). Out of the polled preferences, ‘decoration articles’ were among the lowest scoring gifts, only preferred by 7 percent of female respondents and 6 percent of men.


The Most Preferred Christmas Gifts in the U.S. this Season


Infographic by: statista


Share This Infographic On Your Site

Related Post

Disqus Codes
  • To write a bold letter please use <strong></strong> or <b></b>
  • To write a italic letter please use <em></em> or <i></i>
  • To write a underline letter please use <u></u>
  • To write a strikethrought letter please use <strike></strike>
  • To write HTML code, please use <code></code> or <pre></pre> or <pre><code></code></pre>
    And use parse tool below to easy get the style.
Show Parser Box

strong em u strike
pre code pre code spoiler
embed

Subscribe Our Newsletter

Notifications

Disqus Logo