The fluctuation in gasoline prices is the recent talk of the
town. This article compares the gasoline prices in the past with the recent run
up.
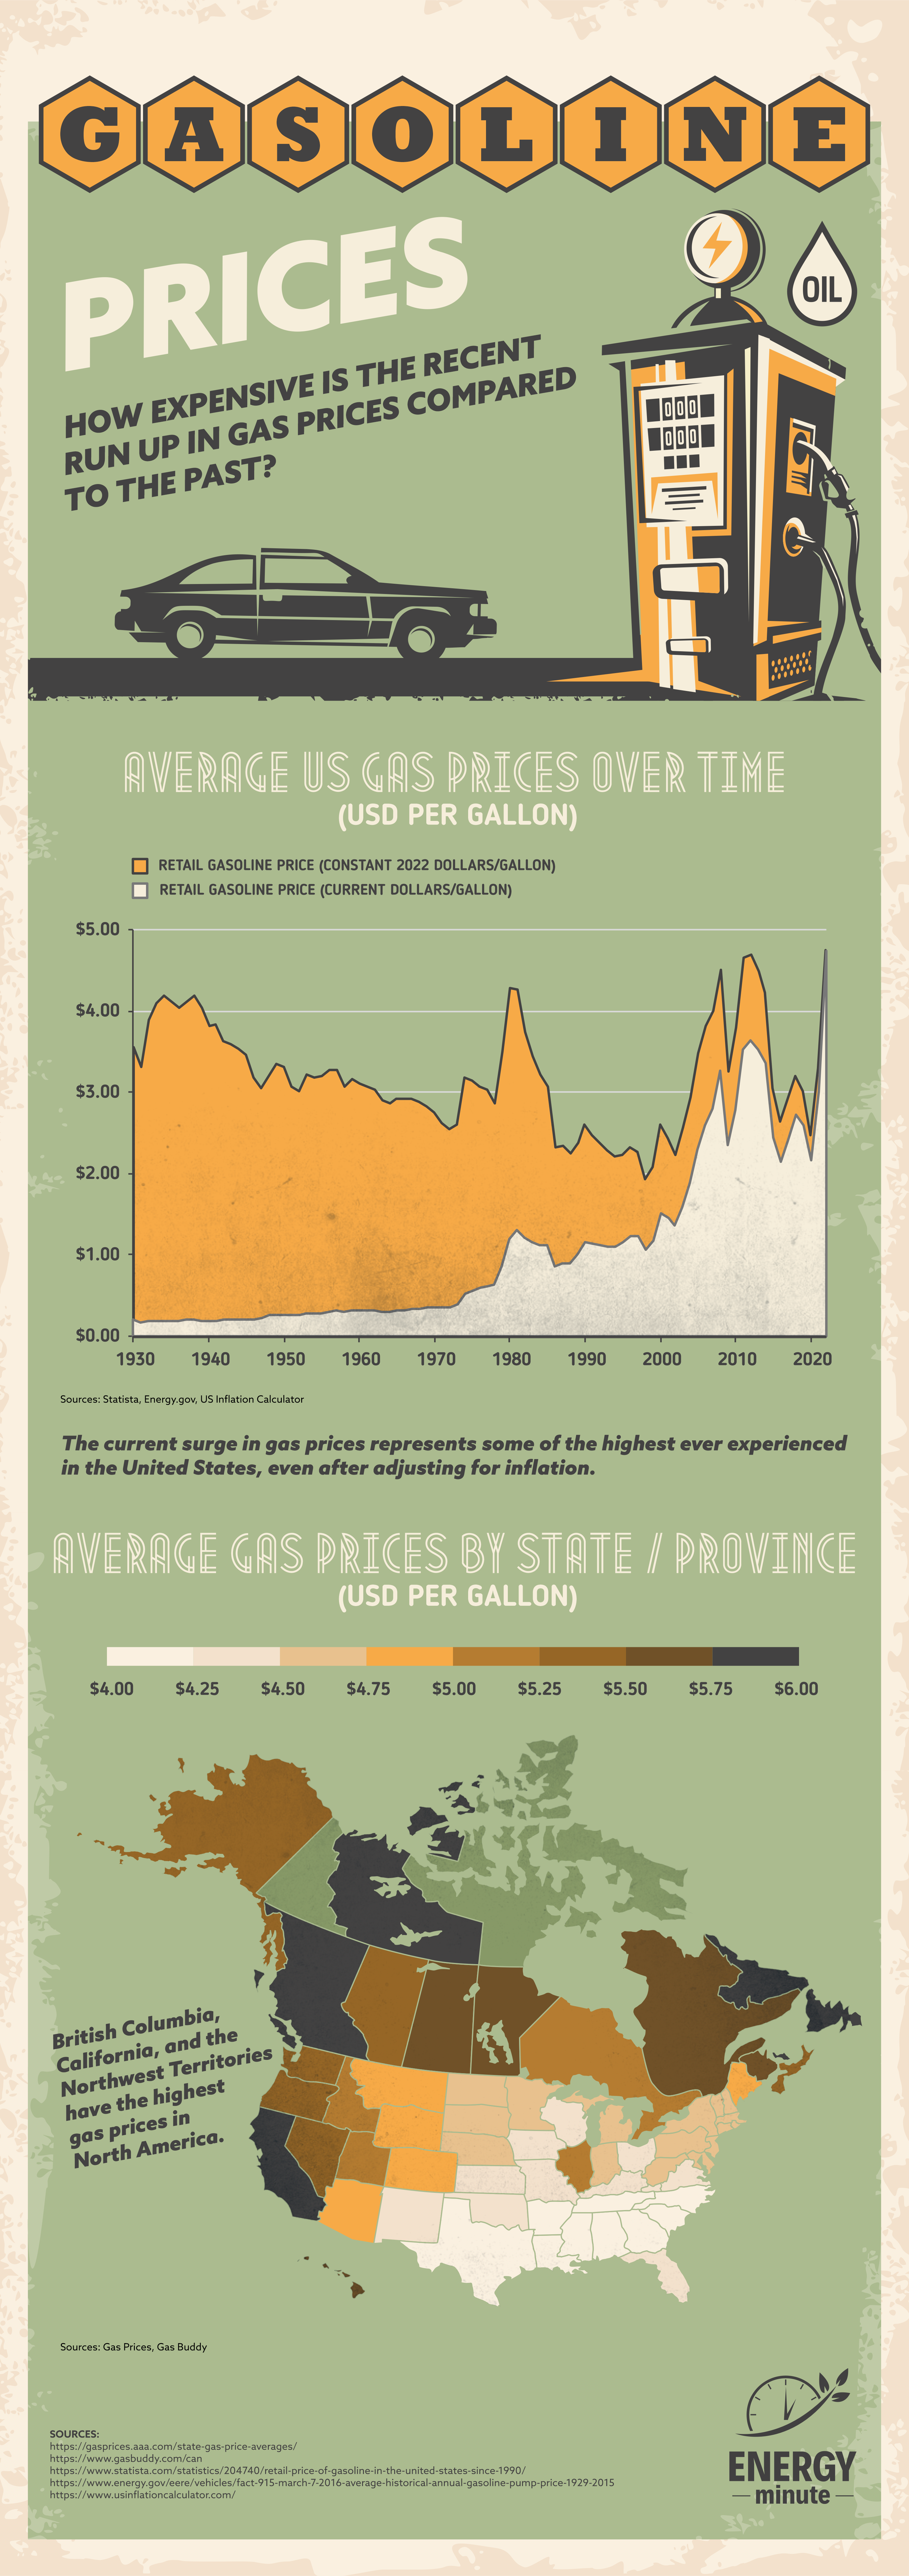
The chart below shows average gas prices over past 90 years. Prices mentioned are approximate figures in USD per gallon.
|
Year |
Retail Gasoline Price
(Constant 2022 Dollars/Gallon) |
Retail Gasoline Price (Current
Dollars/Gallon) |
|
1930 |
3.5 |
0.2 |
|
1940 |
4.2 |
0.2 |
|
1950 |
3.4 |
0.3 |
|
1960 |
3.1 |
0.4 |
|
1970 |
2.8 |
0.45 |
|
1980 |
2.9 |
1.4 |
|
1990 |
2.6 |
1 |
|
2000 |
2.6 |
1.5 |
|
2010 |
3.3 |
2.4 |
|
2020 |
2.5 |
2.4 |
|
2022 |
4.75 |
4.75 |
There is a difference in the gas prices according to the
provinces/states. In Northern America, California, British Columbia and Northwest
Territories have the maximum gas prices. Gas prices in these regions are
approximately 6 USD. While lowest gas prices are in the US states of Mississippi,
Georgia and South Carolina.
Infographic by: energyminute


