Would you be surprised to find out that the average American spends $1,200 on fast food every year? Or that 23% of adults eat three or more fast food meals each week? The proof is in the pudding, or should I say, the fries.
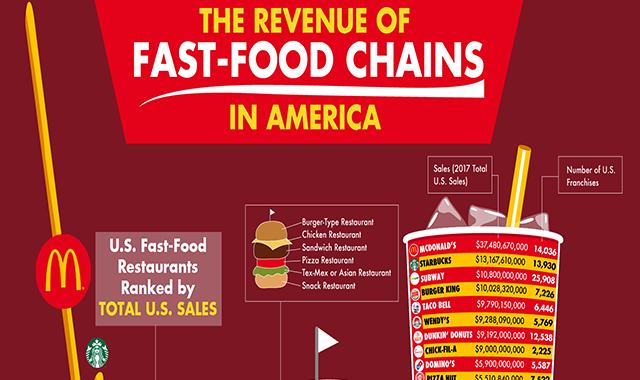
This infographic breaks down the annual revenue of the top 30 fast food chains in America. You may be shocked to see just how much the fast food giant, McDonald's, makes in total annual sales; and how much higher those sales are than Starbucks which landed in the number two spot. This infographic also breaks down the number of franchises each chain has in the United States, and proves that more franchises does not always mean more in sales!
With 23% of adults eating three or more fast food meals each day and 34% of children consuming fast food on any given day, it’s no surprise that so many fast food chains have annual revenues in the billions.
infographic by: www.titlemax.com


