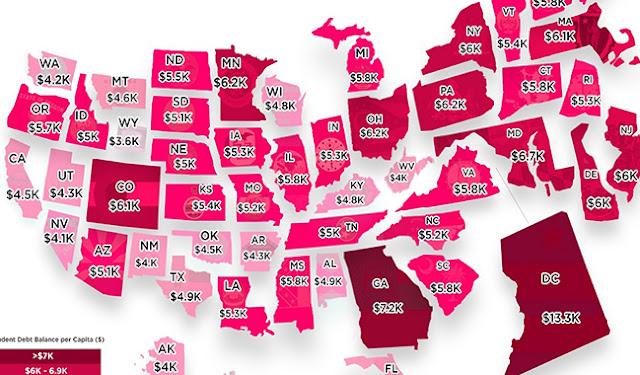
The interactive map draws on credit reporting data on student debt compiled by Experian as well as income data from the American Community Survey conducted in 2013. Researchers used the Experian data to measure the average loan balance and the delinquency rate in zip codes throughout the country. When combined with the ACS demographic data, this allows the resulting choropleth maps to capture the stark differences between regions of the United States as well as well as variations within metropolitan areas.

